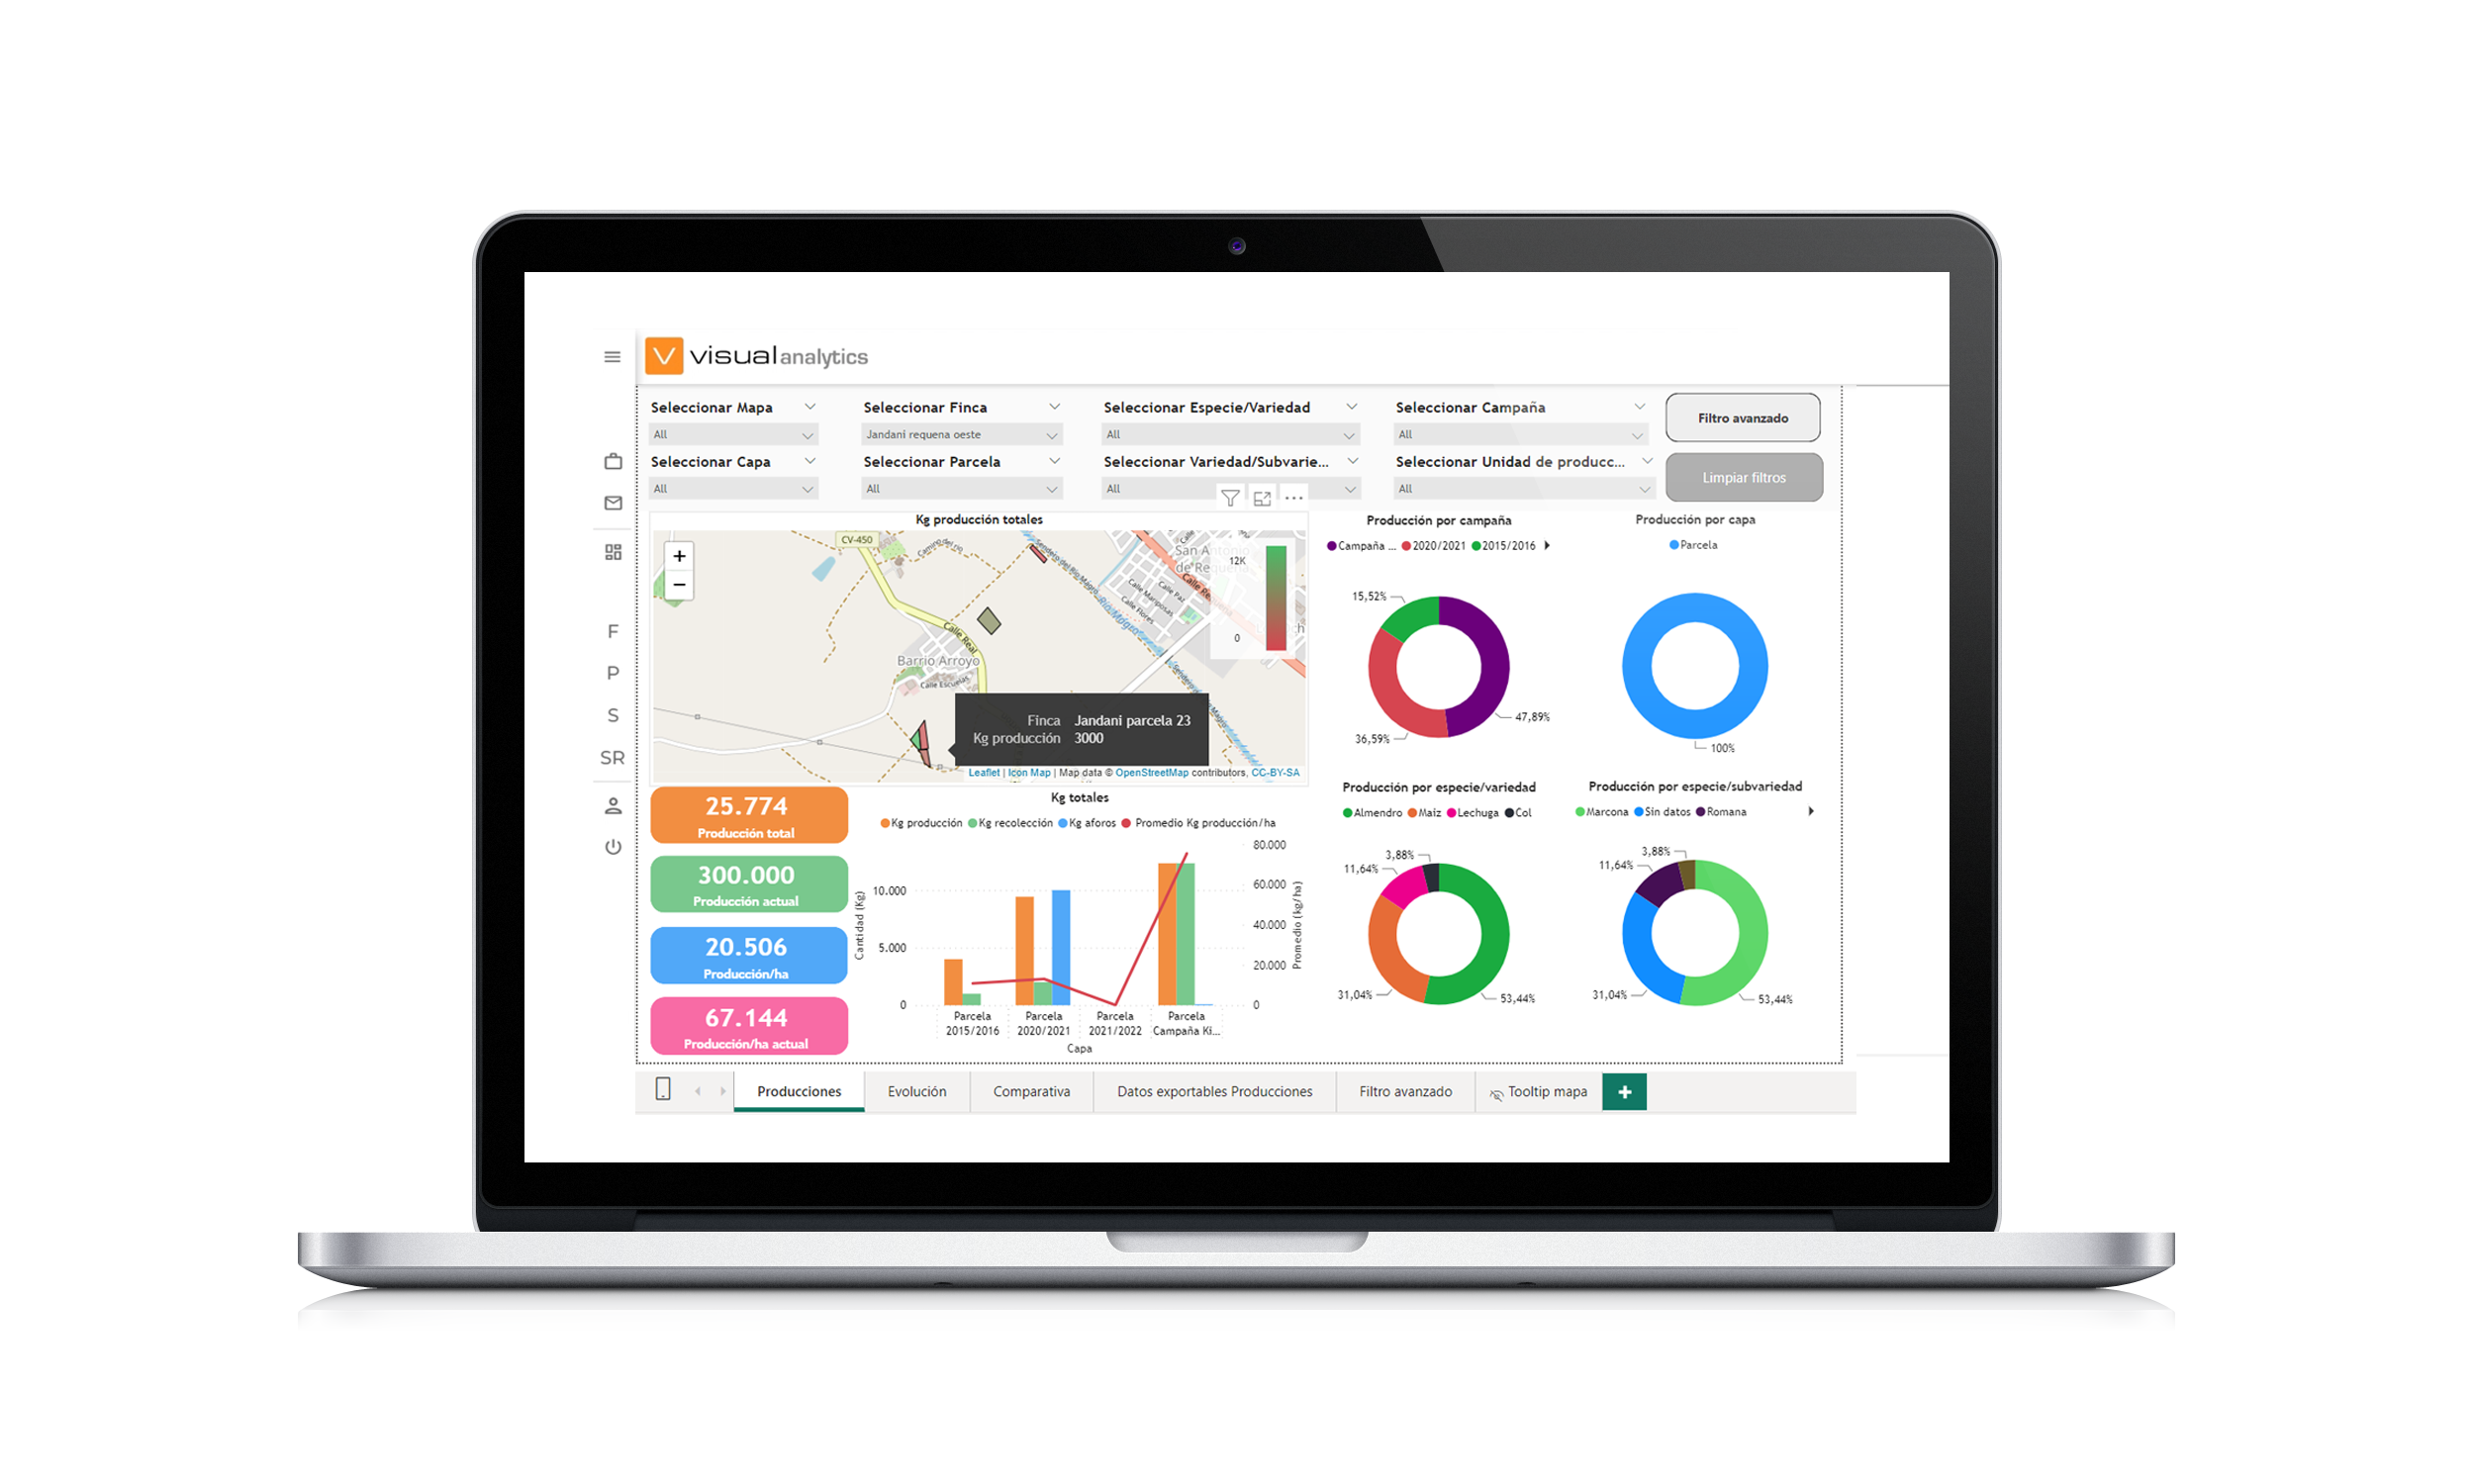
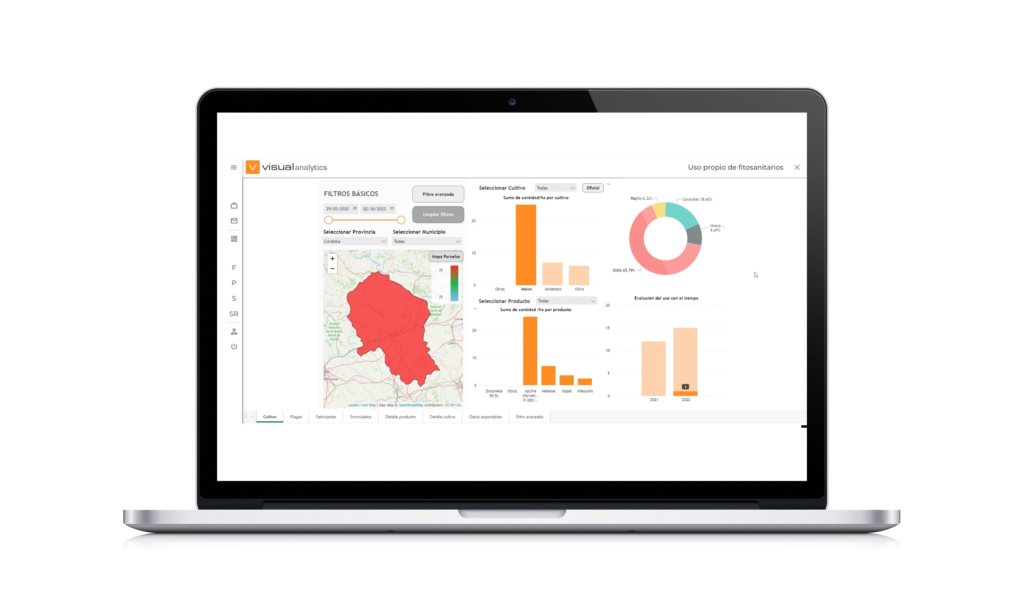
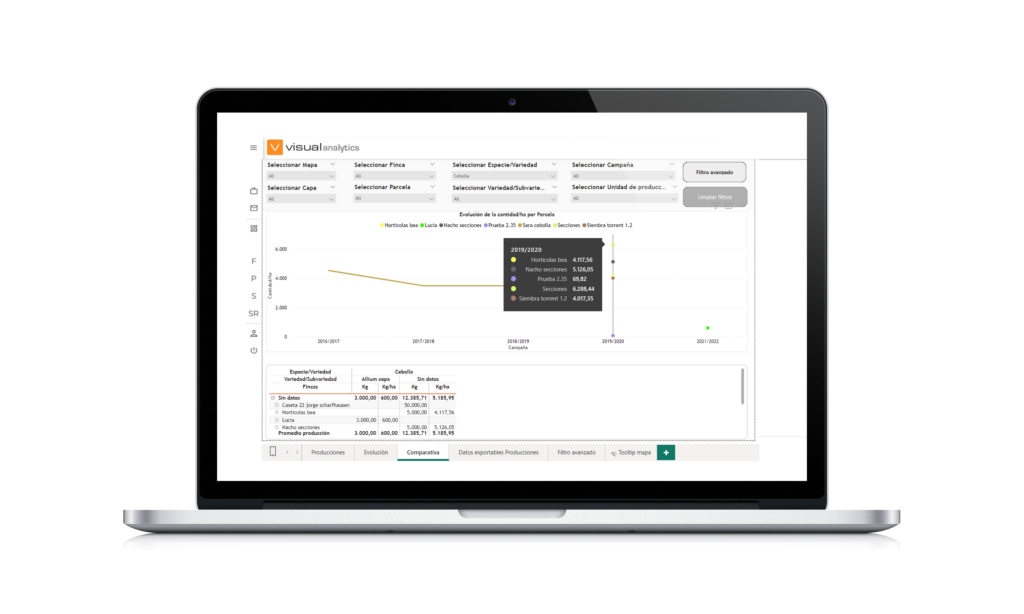
We know that it’s not just about having the data; you need to know how to interpret it. Visual Analytics is our solution to achieve this. We gather, analyze, and visualize data in an easy-to-understand way.
As experts in data lifecycle management, we extract data from the Visual platform, standardize it, and refine it, identifying any anomalies. Then, we use this data to perform in-depth analysis. As a result, our reports are more detailed, comprehensive, and up-to-date. Furthermore, we have improved and updated our graphics to make them as clear and intuitive as possible, ensuring that information is easily understood.


